My Seating Chart Software Saga
Written by Katrina Ellison Geltman on Sun 02 March 2014.
For the first few weeks of Hacker School, I've been working on a project that began last summer, when I volunteered to help out one of my husband's co- workers. She's responsible for putting together the seating chart for a five- day-long conference every year. She spends a week obsessing over it, making sure that people don't sit together too frequently and that they don't get trapped in the back corner every day. I jumped at the chance to automate the seating chart's creation, thinking it would take me a weekend.
Boy, was I wrong. I did crank out a disgusting-looking script in time for the conference, but my approach - a basic greedy strategy - didn't achieve perfection, and I had no idea what would be better. My husband's co-worker was grateful but disappointed. I was vaguely ashamed. Still, she liked it well enough that she asked for it so she could use it again next year.
At that point I was embarrassed at the mere thought of anyone else ever laying eyes on the code, so I started cleaning it up - but I still had no idea about how to improve my results. It distressed me that I couldn't prove whether or not there was an optimal solution, or even figure out how many possibilities there were. I tried several times, but my math skills just weren't up to it.
Gripped by my problem, I bought CLRS and took an undergrad algorithms course (it was disappointing). I got the Algorithm Design Manual, which seemed like it would be useful, but by then my free time had decreased and I had to table the project until Hacker School began.
By the time I was there, I had decided that simulated annealing might be what I wanted. HS resident Greg agreed that this was a good strategy, and I set out to implement it. My early results were discouraging. I was now using an appropriate algorithm, but my seating charts were no better than the ones I had generated using my naive one.
I kept tweaking the annealing parameters, though, and started to make some progress. I eventually got to a point where I was consistently achieving costs between 60 and 100, which was amazing compared to the 2,000 - 5,000 range of my greedy strategy, to say nothing of the cost of random solutions, which could range into the millions.
And then one day, riding home on the train, I made a minor change, re-ran the program, and saw:
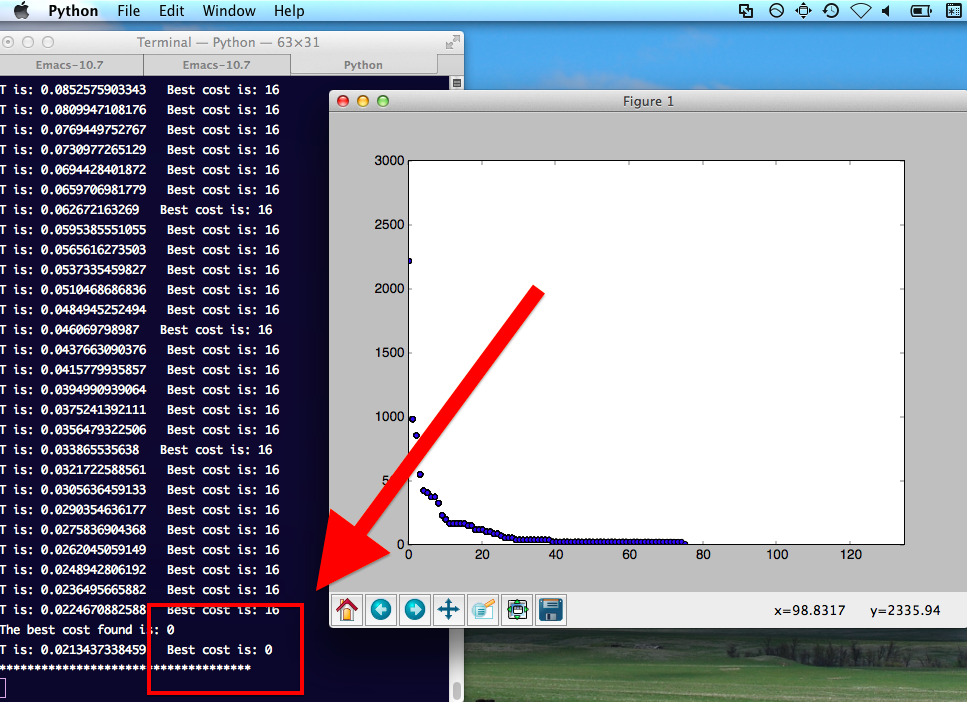
!!!
I couldn't believe it. 8 months after I'd happened upon this problem, I'd finally found what I was looking for. It wasn't a fluke - subsequent runs confirmed that my program really did work.
Of course, to make this a deliverable application, there's still a lot to do: make it faster, build a GUI (gulp), write documentation, achieve reasonable test coverage...
This isn't paid work - the repo is on Github - so in a way it's tempting to put it aside now that I've conquered the part of it that was so vexing. Now, though, I don't think I'll be satisfied until I can put a stamp on this project and say 'done'. In its current form, the code is really 'for' this one person (because a fair amount is hard-coded into it), and I almost feel like it would be rude for me to have worked on her fun problem all year without giving her anything in return.
So my plan is to get all of those things done within the next few months - in time for this year's conference.